 Help Center
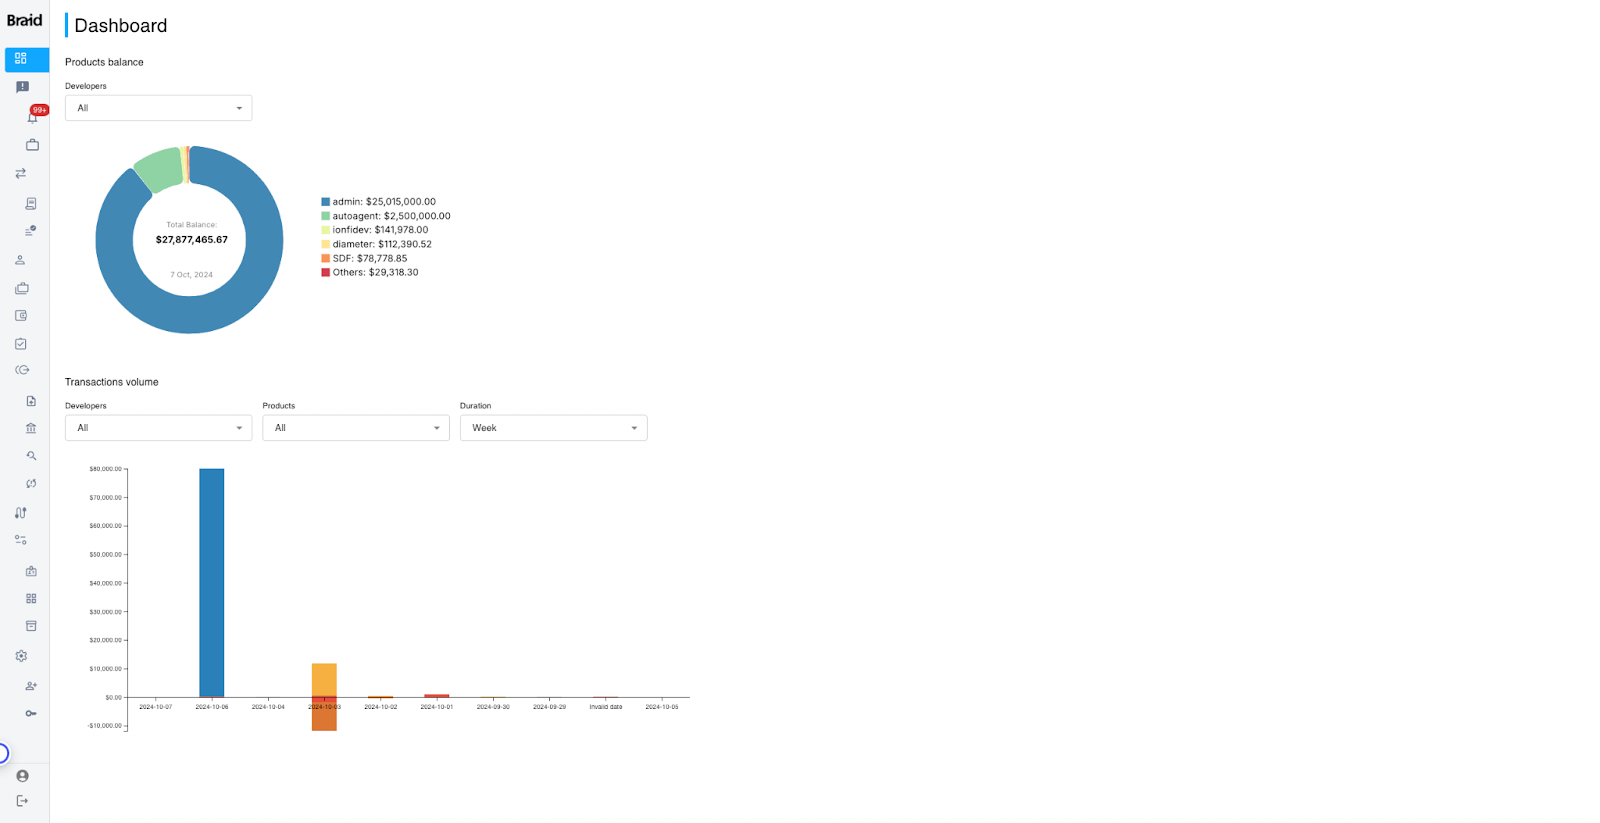
The Braid Dashboard provides a comprehensive view of your financial activities, allowing you to monitor balances, analyze transaction volumes, and filter data for more detailed insights. The main sections of the dashboard include the Products Balance Visualization and Transaction Volume Tracking, along with intuitive filtering options.
Dashboard Features
-
Products Balance Visualization
-
Purpose: This section displays a snapshot of the total balance held across various products.
-
Pie Chart Breakdown:
-
The pie chart represents different product categories or accounts such as:
-
Each segment shows the balance held by each category, providing a quick overview of the distribution of funds.
-
Total Balance: The center of the chart displays the total balance amount, offering a consolidated view of all account balances as of the selected date.
-
Transaction Volume Tracking
-
Purpose: This section helps you track the volume of transactions over time.
-
Bar Chart Breakdown:
-
The bar chart illustrates transaction volume for various dates, allowing users to monitor daily activity.
-
Each bar corresponds to a specific day, showing the transaction volume associated with different products.
-
It is particularly useful for identifying patterns or anomalies, such as spikes or drops in transaction volumes.
-
Filtering Options:
-
You can filter the data by:
-
Developers: Select specific developers to view transaction data related to their activities.
-
Products: Focus on specific products to analyze their transaction performance.
-
Duration: Choose from weekly, monthly, or custom date ranges to adjust the time frame of the data displayed.
How to Use the Dashboard
-
View Balance Details:
-
Navigate to the Products Balance section to see the overall distribution of your balances.
-
Hover over each segment of the pie chart to view the exact balance for each product category.
-
Use this section to quickly assess the allocation of funds and make informed financial decisions.
-
Analyze Transaction Volumes:
-
Scroll to the Transaction Volume section to monitor daily transaction activity.
-
Use the filters to narrow down data to a specific developer or product, providing a focused view.
-
Adjust the Duration filter to track changes over different time periods, helping to identify trends or unusual activities.
-
Apply Filters for In-Depth Analysis:
-
Use the Developers filter to isolate data by specific team members or contributors.
-
Use the Products filter to focus on individual product performance.
-
The ability to adjust filters allows you to customize your view, ensuring you have the precise data needed for deeper analysis.
Best Practices
-
Monitor Regularly: Check the dashboard frequently to stay updated on the financial health of your products and services.
-
Leverage Filters: Use filters to gain targeted insights, especially when troubleshooting issues or evaluating performance.
-
Identify Trends: Analyze transaction volumes over time to identify trends, opportunities for growth, or potential areas of concern.